A control plane that sits between your agents and the model APIs
Routing, fallback, budget enforcement, and human oversight — all managed declaratively. Zero changes to agent code. Full telemetry out of the box.
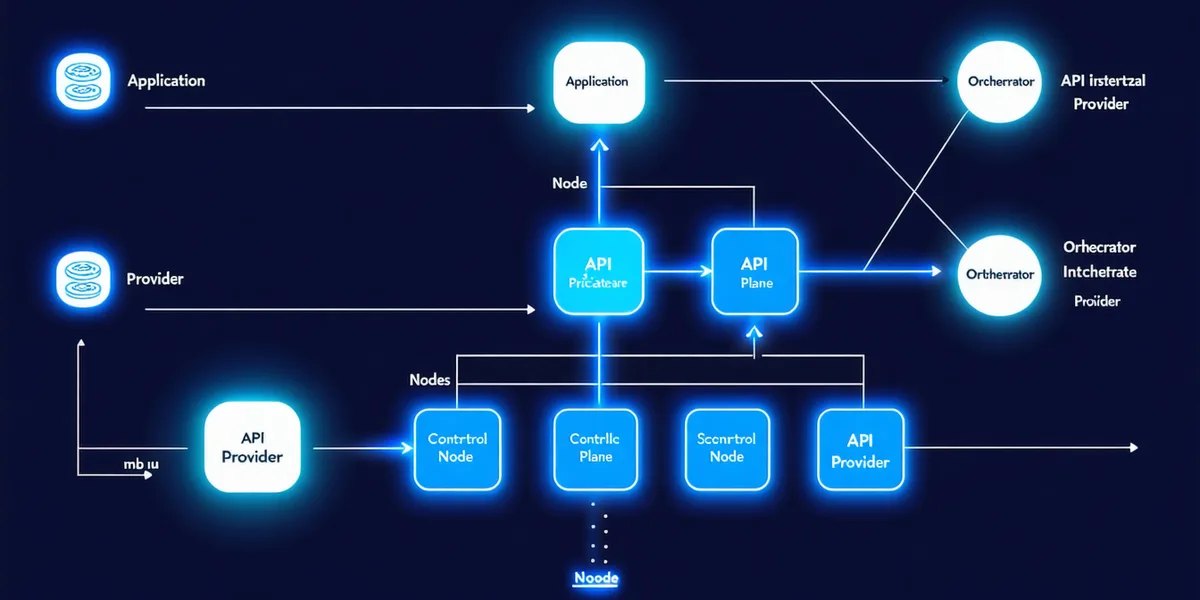
How the control plane fits in your stack
Just as a service mesh sits between services and handles cross-cutting concerns — mTLS, retries, load balancing — OrchVynt sits between your agents and the model APIs, handling orchestration concerns that don't belong in agent code.
OrchVynt intercepts agent invocations at the API boundary. Your agents call orchvynt.route() instead of the model client directly. OrchVynt applies your policy, routes to the right model, enforces budgets, records telemetry — then proxies the response back unchanged.
Policy-driven model selection per invocation
Not every agent invocation needs GPT-4. Route to cheaper models for drafting tasks, expensive models for final review. Define the policy once; OrchVynt executes it on every call.
Define the survival path once
OrchVynt activates the fallback chain automatically on 429s, 5xx errors, timeout thresholds, or explicit cost caps. One definition, one place to change, one place to observe.
Not advisory limits — hard enforcement
OrchVynt intercepts invocations that would exceed per-workflow or per-session budgets before they reach the model. The invocation doesn't happen; the budget is respected.

Insert approval checkpoints that pause workflow execution
HITL gates are a governance primitive, not a safety net. Enterprise teams need them for compliance — financial decisions, PII handling, regulated content — not just because they don't trust the model.
Workflow observability — in the stack you already use
Every routing decision, fallback activation, budget enforcement event, and HITL resolution is emitted as structured telemetry. OrchVynt doesn't ask you to learn a new observability tool — it drops into Datadog, Grafana, Honeycomb, or any OpenTelemetry-compatible backend.
OpenTelemetry trace export
Emits OTLP traces compatible with any OpenTelemetry backend. Every agent hop is a span with routing decision metadata attached.
Prometheus metrics endpoint
Exposes /metrics endpoint. Scrape it with your existing Prometheus instance. Pre-built Grafana dashboard included.
Structured JSON event log
Every orchestration event logged as structured JSON. Ship to S3, GCS, or local filesystem. Compliance export in CSV format.
Get the control plane running in under 10 minutes
Pull the Docker image, write a three-line config, point your agents at localhost:4821.